
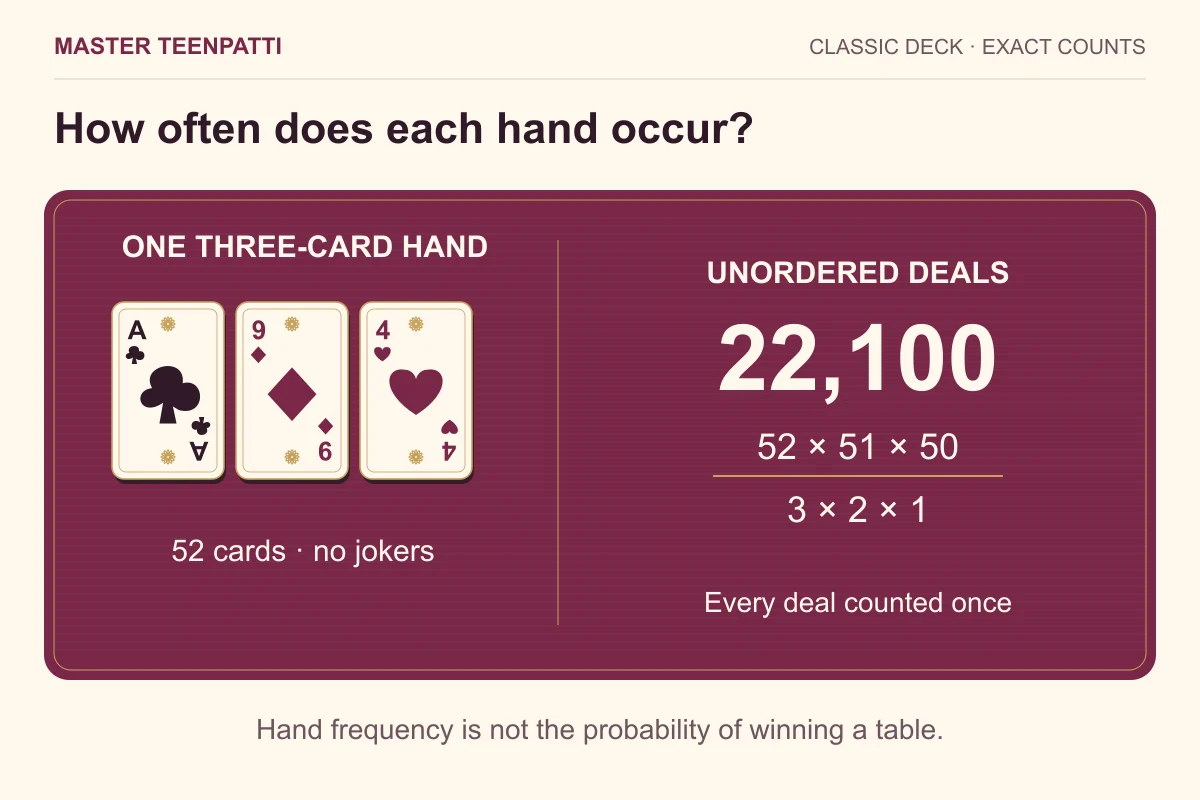
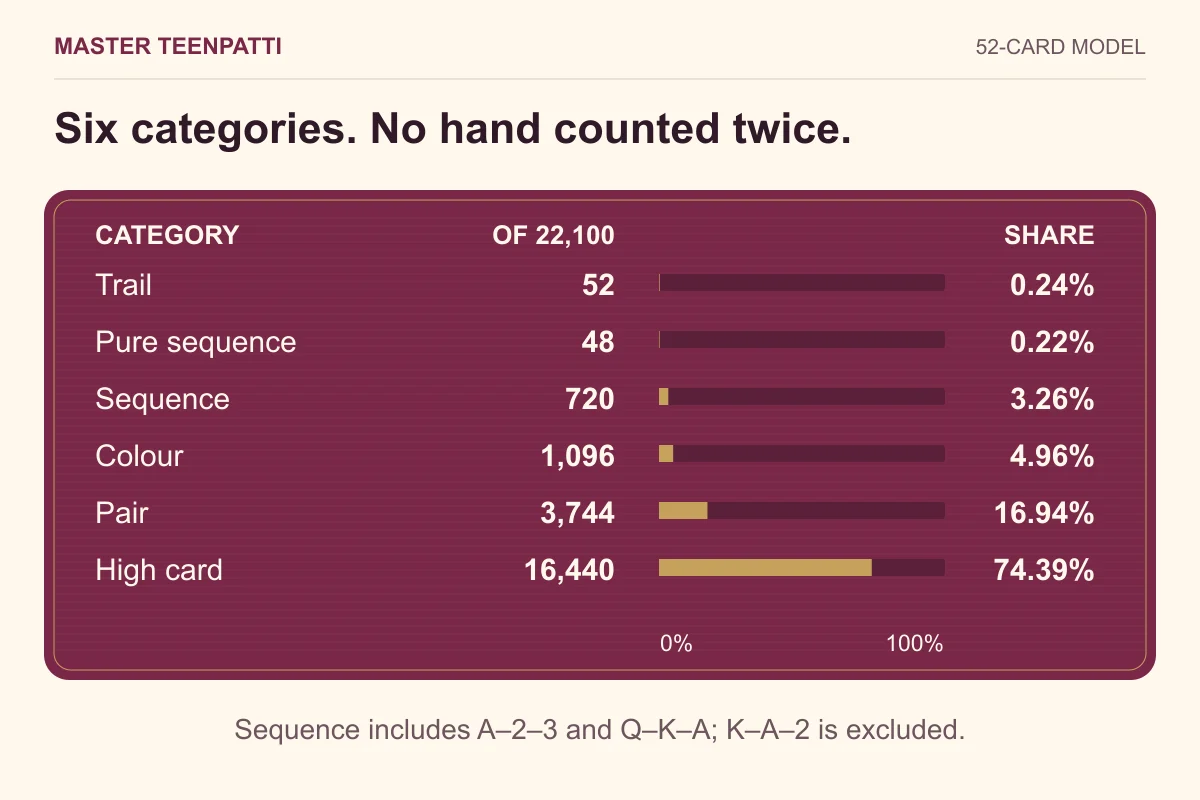
A standard 52-card deck has 22,100 different three-card hands. Under the classic no-joker categories used here, 52 are trails and 48 are pure sequences. These are frequencies of a single dealt hand—not your chance of beating the other players.
What the numbers assume
This calculation uses one complete 52-card deck, three cards dealt without replacement and no wild cards. Every unordered set of three cards has the same chance. We allow both A-2-3 and Q-K-A as sequences, but not K-A-2. The ace ordering used to break a tie does not change the counts, provided those same twelve rank sequences remain valid.
A hand belongs to exactly one category. Three consecutive cards of one suit count as pure sequence, not again as sequence or colour. Three matching ranks count as trail, not pair. This matters when comparing published probability tables: a table that includes straight flushes inside its flush count is answering a different question. For the category definitions, start with the hand-ranking guide.
The complete distribution
Each percentage below is the category count divided by 22,100, multiplied by 100. The six counts add up to the whole deck model. Percentages are rounded to three decimal places, so adding the displayed percentages can differ slightly from 100%.
Swipe sideways to see all columns →
| Hand category | Combinations | Probability |
|---|---|---|
| Trail | 52 | 0.235% |
| Pure sequence | 48 | 0.217% |
| Sequence | 720 | 3.258% |
| Colour | 1,096 | 4.959% |
| Pair | 3,744 | 16.941% |
| High card | 16,440 | 74.389% |
Why the denominator is 22,100
There are 52 choices for the first card, 51 for the second and 50 for the third. That makes 132,600 ordered deals. But A♣, 9♦, 4♥ and 4♥, A♣, 9♦ describe the same hand. Each set of three distinct cards can arrive in six orders, so divide by 3 × 2 × 1: 52 × 51 × 50 ÷ 6 = 22,100.
This is a count of possible hands, not a prediction about how often an app must display a particular result in a short session. The model also assumes a uniformly shuffled deck. It does not inspect an app’s random-number generator or prove that a particular game implements these assumptions.
Count trails, pure sequences and sequences
For a trail, choose one of thirteen ranks, then choose three of its four suits. There are four ways to leave one suit out, giving 13 × 4 = 52 trails. For a pure sequence, choose one of twelve permitted rank sequences and one of four suits: 12 × 4 = 48.
For an ordinary sequence, begin with the same twelve rank patterns. Each of its three ranks can have any of four suits, giving 4³ = 64 suit patterns. Four are all one suit and have already been counted as pure sequences. Remove those, then multiply: 12 × (64 − 4) = 720.
Notice the small surprise: pure sequences are slightly less frequent than trails in this model, even though a trail ranks higher in the usual Teen Patti hierarchy. Frequency does not write the rules. The sequence-versus-colour examples explain why comparing categories comes before comparing individual cards.
Count colour, pair and high card
A suit contains thirteen cards. Choose any three within that suit and there are 286 sets. Across four suits that is 1,144 same-suit hands. Remove the 48 pure sequences to leave 1,096 colours. An A-J-7 hand of hearts is a colour; 6-7-8 of hearts belongs in the pure-sequence row.
For a pair, choose its rank in thirteen ways and two of its four suits in six ways. The third card must be a different rank: twelve choices of rank and four choices of suit. Thus 13 × 6 × 12 × 4 = 3,744. This excludes trails by construction. Finally, subtract the five other categories from 22,100; the remaining 16,440 hands are high card.
Why a pair’s frequency is not its win probability
The 16.941% pair figure answers “How often does one random three-card hand contain exactly a pair?” It does not answer “How often will my pair win?” That second question depends on the pair’s rank, its third card, the number of opponents, their available cards and any information revealed during play.
Once you know your three cards, opponents are dealt from the remaining forty-nine. Their hands are not independent copies of a fresh 52-card deal. Multiplying the simple percentages above is therefore not a reliable shortcut to table-wide winning odds. Nor does a run of high-card hands make a trail “due” after a complete reshuffle. Avoid turning a frequency table into a reason to chase losses.
Try a counting exercise without stakes
Take a real deck and deal one three-card hand. Write its category, return all three cards, shuffle, and repeat. Compare your tally with the table after twenty or fifty deals. A small sample will often look uneven; zero trails in fifty deals is not surprising when trails occur in fewer than one in four hundred hands on average.
The useful exercise is checking your classifications. Did you accidentally record a pure sequence as colour? Did a trail slip into the pair column? Use the offline practice worksheet to compare examples, then revisit the definitions. Joker and AK47 tables need a different model; read the wild-card rules before applying any classic-deck probabilities.
If you keep the same deck but reverse which category is preferred, the category counts stay unchanged. The Muflis worked examples make that distinction between a hand’s frequency and its result clear.
Questions readers ask
Is pure sequence rarer than trail?
Yes, in this stated model: 48 pure sequences versus 52 trails out of 22,100 hands. The usual ranking still places trail above pure sequence.
Does A-2-3 change the probabilities?
Accepting A-2-3 as well as Q-K-A gives twelve valid rank sequences. Excluding either changes the counts. Merely changing which of those two ranks higher does not.
How common is a high-card hand?
There are 16,440 high-card hands out of 22,100 in this model, about 74.389%. High card is the most common category, but it is the lowest-ranked category in ordinary Teen Patti.
Sources & scope
Category definitions are grounded in Octro’s published learning guide. The combinatorial calculations and worked examples were prepared for this article and independently checked by enumerating all 22,100 three-card combinations. They do not describe a tested app feature or promise a playing outcome.